Introduction:
Traders are often on the lookout for the ideal pattern on the chart, be it double bottoms, ascending triangles, wedges, or others. However, the question arises: how crucial are these patterns on their own? They should be regarded as formations that traders analyze to make predictions about future price movements. The trick lies in the fact that while a pattern is easy to spot once formed, it is easier to overlook in real-time. Hindsight is self-explanatory. I cannot say that I am a big believer in the so-called chart patterns, at least not in all of them.
In my opinion, things equally important include the time of day. Although not considered an indicator, I would recommend every novice trader to trade at the right time of the day instead of during the quiet Asian hours or European nighttime. In another article, I would like to delve deeper into some other topics, but let’s stick to the chart patterns for now. Specifically, I would like to introduce you to two patterns that are easily recognizable. Namely the 3 Day pattern.
Rise and Fall:
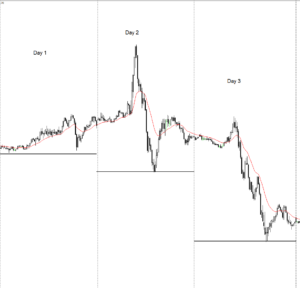
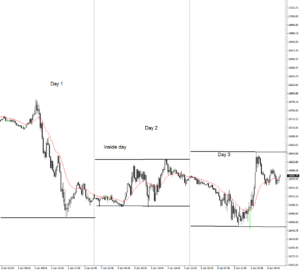
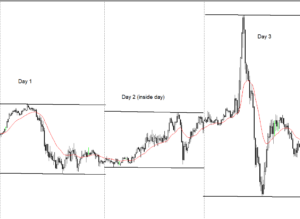
The 3 day pattern comes in two variations. Firstly, I will introduce you to the three days of rise, and secondly, to the three days of fall. The three days of fall or rise pattern are easily recognizable and can be identified over a span of three trading days. If we observe three consecutive higher highs or lower lows, for example, when trading on a Wednesday, and the low of Wednesday is lower than Tuesday, and the low of Tuesday is lower than Monday, we can identify this as three days of fall. The level, in this case, refers to the lower level of each day. The opposite is true for three days of rise. If we see three consecutive daily highs, we can identify this as three days of rise. Another variation of the three days is the inside day variation. In this case, the middle day is an inside day, meaning the high and low are inside those of the previous day. For instance, if we are trading on Wednesday, Tuesday should be the inside day, indicating that the high on Tuesday is lower than the high on Monday, and the low on Tuesday is higher than the low on Monday.
To summarize:
- Three levels of rise (3 consecutive highs)
- Three levels of fall (3 consecutive lows)
Hard-Coded Rules:
Three days of Rise (3 Consecutive Highs):
- Current day high is higher than the previous day’s high.
- Current day high is higher than the day before yesterday’s high.
Three days of Fall (3 Consecutive Lows):
- Current day low is lower than the previous day’s low.
- Current day low is lower than the day before yesterday’s low.
Examples on the German DAX:

Three days of fall (3 consecutive lows)

Three days of fall (inside day)
Significance:
You might be wondering why this could be important. Well, from my observations throughout the years, three levels of fall or rise often lead to a strong momentum move, resulting in either a reversal or a continuation movement in the direction of the trend. For example, if we observe three consecutive days of fall, and the price continues to decrease, we refer to it as a trend continuation. If the price goes in the opposite direction, we speak of a reversal. In these scenarios, what often occurs is that the price initially retraces and later forms a high-of-day trend continuation pattern. On a shorter timeframe, this might suggest an uptrend, but on the larger template, the market is still trending in the opposite direction.The main idea behind a three-day setup is that it accumulates orders, meaning multiple timeframe traders will be in the market. When everyone is in the market, this usually results in increasing momentum, providing traders with an opportunity to take advantage of it. Another primary objective of the three-day setup is to create a measurable environment, making it easy to spot chart patterns that follow hard-coded rules.Which create a binary approach to the market.
Continuation or Reversal:
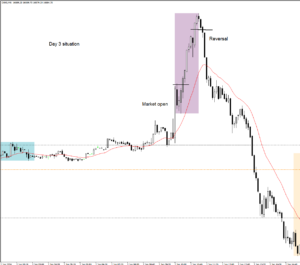
In the charts below, we have an example of a three-day setup on the German Dax. In both directions, long and short, traders had great opportunities to take advantage of the three-day pattern. At the market open, the price almost directly goes in a parabolic strong direction. Basically, only this trade can make a trading day for a trader. Traders might spot the reversal and bet on it. While if we are in the three setup, the likelihood of reversal, even after a continuation, is still very high. Of course, other factors will be important. If we are in a very strong bullish market, where the price makes high after high, it might not always be a good idea to bet on reversals. This will come with experience. Bear in mind that you should not short the top of the market just because it’s at the top. In another article, I will discuss how we can enter the market in case we are in a three setup situation.

